Last year, the Covid-19 pandemic dramatically impacted global energy markets, with primary energy and carbon emissions falling at their fastest rates since the end of WWII, according to BP’s annual Statistical Review of World Energy.
Nevertheless, during the same period, renewable energy continued to grow, with solar power recording its largest-ever increase.
The data collected in this year’s edition includes energy data for 2020 – one of the most turbulent years the world has seen.
This year’s Review captures the dramatic impact the pandemic had on energy markets and how the ‘year of COVID’ may help shape future trends.
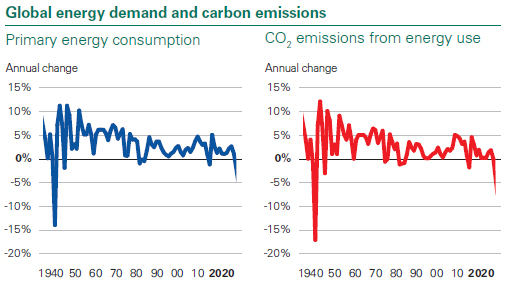
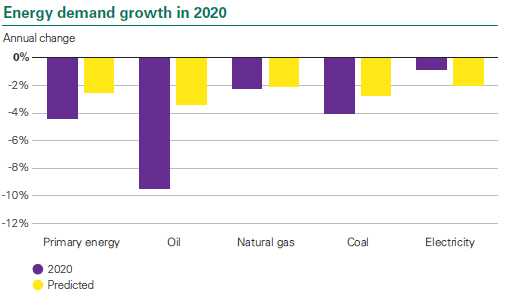
Primary energy consumption fell by 4.5% in 2020 – the largest annual decline since 1945.
This was driven mainly by oil, which accounted for almost three-quarters of the net decline.
Natural gas prices also declined to multi-year lows; however, the share of gas in primary energy continued to rise, reaching a record high of 24.7%.
Meanwhile, wind, solar and hydroelectric generation all grew despite the fall in overall energy demand.
Wind and solar capacity increased by a colossal 238 GW in 2020 – 50% larger than at any time in history.
By country, the US, India, and Russia saw the largest declines in energy consumption. China saw the largest increase (2.1%), one of only a handful of countries where energy demand grew last year.
Carbon emissions from energy use fell by over 6% in 2020, the largest decline since 1945.
“For the Review – as for so many of us – 2020 will go down as one of the most surprising and challenging years.
The global lockdowns had a dramatic impact on energy markets, particularly on oil, whose transport-related demand was crushed,” said Spencer Dale, bp’s chief economist.
“Encouragingly, 2020 was also the year the share of renewables in global power generation recorded its fastest-ever increase – a growth that came largely at the expense of coal-fired generation.
These trends are exactly what the world needs to see as it transitions to net-zero – strong growth in renewables crowding out coal,” Dale said.
“The importance of the past 70 years pales into insignificance as we consider the challenges facing the energy system over the next 10, 20, 30 years.
“To reach net-zero, the level of ambition shown by countries and companies needs to translate into significant, sustained falls in emissions.
“Everyone, from business to governments to consumers, has a role to play in delivering that.”
Bernard Looney, bp’s CEO, added: “This year’s Review provides all of us with the objective and timely data needed to make sense of the most tumultuous events affecting energy markets in any of the past seven decades.
“Companies like bp with net-zero ambitions, coherent plans, and near, medium and long-term aims – companies which are committed to ‘greening’ – have a hugely significant part to play in achieving the Paris goals.
“Yes, the world needs more low-carbon companies.
“But maybe more than anything, it also needs existing energy companies to decarbonise and in so doing use their scale and expertise to help bring about the deep and complex rewiring and replumbing of the global energy system that the world wants and needs to see over the next 30 years.
“It will take producers and consumers, as well as companies, governments, and society, all working together to bring about the necessary change.”
Since it was first published in 1952, the Statistical Review has been a source of objective, comprehensive data and analysis to help industry, governments, and commentators understand and interpret developments in global energy markets.
Over time, the Review has provided insights into some of the most dramatic episodes in the history of the global energy system, including the Suez Canal crisis in 1956, the oil embargo of 1973, the Iranian revolution in 1979 and the Fukushima disaster in 2011.
The following are some of the Review’s highlights concerning the different types of fuels:
Oil
- The oil price (Dated Brent) averaged $41.84/bbl in 2020 – the lowest since 2004.
- Global oil demand fell 9.3%, with the largest falls in the US (-2.3 mln b/d), the EU (-1.5 mln b/d) and India (-480,000 b/d). China was the only country where consumption increased (220,000 b/d).
- Refinery utilisation fell by a record 8.3 percentage points to 73.9%, the lowest since 1985.
Natural gas
- Natural gas prices declined to multi-year lows: US Henry Hub averaged $1.99/mmBtu in 2020 – the lowest since 1995, while Asian LNG prices (Japan Korea Marker) registered their lowest level on record ($4.39/mmBtu).
- However, the share of gas in primary energy continued to rise, reaching a record high of 24.7%.
- LNG supply grew by 4 bcm or 0.6%, well below the 10-year average growth rate of 6.8%. As a result, US LNG supply expanded by 14 bcm (29%), partially offset by declines in most other regions, notably in Europe and Africa.
Coal
- Coal consumption fell by 6.2 exajoules (EJ), or 4.2%, led by declines in the US (-2.1 EJ) and India (-1.1 EJ). OECD coal consumption fell to its lowest level in bp’s data series back to 1965.
- China and Malaysia were notable exceptions, with consumption up by 0.5 EJ and 0.2 EJ, respectively.
Renewables, hydro and nuclear
- Renewable energy (including biofuels but excluding hydro) rose by 9.7%, slower than the 10-year average (13.4% p.a.), but the absolute increment in energy terms (2.9 EJ) was similar to increases seen in 2017, 2018 and 2019.
- Solar electricity rose by a record 1.3 EJ (20%). However, wind (1.5 EJ) provided the largest contribution to renewables growth.
- Solar capacity expanded by 127 GW, while wind capacity grew 111 GW – almost double its previous highest annual increase.
- China was the largest contributor to renewables growth (1.0 EJ), followed by the US (0.4 EJ). Europe, as a region, contributed 0.7 EJ to the rise.
Electricity
- Electricity generation fell by 0.9% – more than the decline in 2009 (-0.5%), the only previous year in bp’s data series since 1985 that had seen a decline in electricity demand.
- The share of renewables in power generation increased from 10.3% to 11.7%, while coal’s share fell 1.3 percentage points to 35.1% – a new low in bp’s data series.
Costis Stambolis is a Financial Mirror correspondent based in Athens