By John Lonski, Chief Economist, Moody’s Capital Markets Research
From the perspective of the U.S. equity market, COVID-19 is the worst natural disaster ever. After setting a record high on February 19, the market value of U.S. common stock has subsequently plummeted by $10.8 trillion, or by 31.2%, to its lowest close since January 30, 2017.
A prospective swelling of the U.S. government budget deficit in response to a COVID-19-inspired surge in federal spending now menaces the outlook for Treasury bond yields. However, the Fed has the power to counter any unwanted climb by Treasury bond yields by purchasing Treasury bonds, which is also known as quantitative easing. Both the European Central Bank and the Bank of England recently announced new quantitative easing programs. Perhaps, the Fed will soon do likewise.
Regarding federal spending, some liken the current battle against COVID-19 to a wartime situation. Thus, it may be of interest that during the World War II years of 1942 through 1945, the U.S. government’s budget deficit averaged 22.2% of nominal GDP, wherein the annual budget deficit peaked at 1943’s 30.3% of GDP. For now, it’s doubtful that the ratio of the federal budget deficit to GDP will approach the extremes of the Second World War.
The U.S. government budget deficit of calendar-year 2019 approximated 4.8% of GDP. An early March Bloomberg consensus forecast had 2020’s federal budget deficit edging up to 4.9% of GDP, but that projection is likely to be very much on the low side.
During World War II, outstanding U.S. government debt peaked at 120% of GDP. Currently, U.S. government debt approximates 80% of GDP, where the latest Bloomberg consensus expected federal debt to edge up to 81.3% of GDP by 2020’s final quarter. That projection is also likely to prove to be too low.
Speaking of government budgets, the tax revenues of many state and local governments are likely to be reduced by declines in business activity and incomes. For example, sales tax revenues may drop considerably. Some state and local governments may ask Washington to help them bridge a temporary loss of tax revenues.
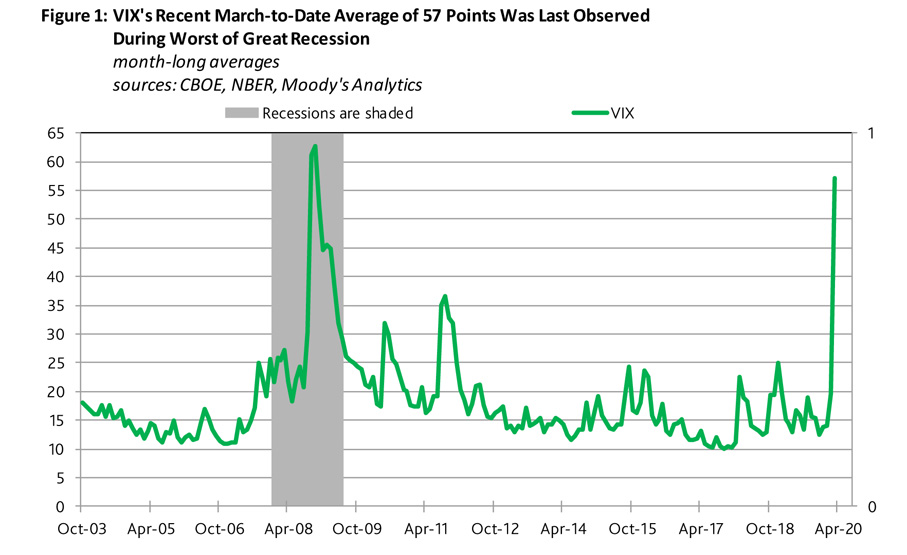
The VIX was at an alarmingly high 69.2 points during the afternoon of March 19. To date in March, the VIX has averaged 57.6 points. Since VIX’s estimation methodology was revised in September 2003, a recession overlapped each of the three earlier months when the VIX averaged more than 50 points, namely November 2008 (62.6 points), October 2008 (61.2 points), and December 2008 (52.4 points).
Nevertheless, the U.S. equity market was substantially higher one year later for 13 of the 14 months where the VIX averaged more than 30 points.
For the six months showing a month-long average for the VIX above 40 points, the monthly average for the market value of U.S. common stock 12 months later was higher by 33% year-to-year, on average.
For the nine months showing a month-long average for the VIX above 35 points, the monthly average for the market value of U.S. common stock 12 months later was higher by 32%, on average.
Finally, for the 14 months showing a month-long average for the VIX above 30 points, the monthly average for the market value of U.S. common stock 12 months later was higher by 25%, on average. Only one of the 14 months showed a yearly decline by the market value of U.S. common stock 12 months later. Twelve months after the VIX averaged 30.2 points in September 2008, September 2009’s monthlong average for the market value of U.S. common equity fell by 13% year-to-year.
Persistently High VIX Warns of Much Wider Spreads
Corporate bond yield spreads will widen considerably from their already very broad bands if a now ultrahigh VIX does not plunge by more than 40 points from its recent 69 points.
When the VIX averaged 58.7 points during 2008’s final quarter, the accompanying averages were 545 basis points for Moody’s Analytics’ long-term Baa industrial company bond yield spread and 1,700 bp for a composite high-yield bond spread.
Though VIX’s average fell to 45.0 points during 2009’s first quarter, the accompanying averages barely dipped to 510 bp for the long-term Baa industrial company bond spread and to 1,627 bp for the highyield bond spread.
As of March 18, the long-term Baa industrial company bond yield spread was at 357 bp, which was the widest since the spring of 2009, while the composite high-yield bond spread of 988 bp was the broadest since June 2009.
After setting a 64-year low at the 3.56% of March 6, MA’s long-term Baa industrial company bond yield quickly shot up to March 18’s 5.36%. The latter was the highest since the 5.37% of January 18, 2019. The rapid ascent by the Baa industrial bond yield adds to business cycle risks.
Average High-Yield EDF Metric Breaks Above 10%
A now weak and volatile U.S. equity market helps to explain the lift-off by MA’s average high-yield expected default frequency metric from year-end 2019’s 4.18% to March 18’s 10.62%. The high-yield EDF last broke above 10% in October 2008. During the Great Recession, the month-long average of the high-yield EDF eventually crested at the 14.6% of February 2009. Ultimately, the U.S. high-yield default rate peaked at November 2009’s 14.7%.
When the market value of U.S. common stock had set a record high on February 19, 2020, the average high-yield EDF had already climbed to 5.08%, which was well above its post-September 2003 median of 3.48%. Meanwhile, the VIX had increased from year-end 2019’s 13.8 points to February 19’s 14.4 points.
Unlike the average high-yield EDF, February 19’s VIX was less than its post-September 2003 median of 15.7 points. Coincidentally, the VIX’s 2020-to-date bottom is the 12.1 points of January 17, or the final close before COVID-19 fears first rattled U.S. financial markets.
A Brief Look at the History of the One-Year Baa Default Rate
During the 35-years-ended 2019, the one-year Baa default rate averaged 0.19%. After remaining at 0.00% for each of the four-years-ended 2018, the one-year default rate of Baa-grade bonds edged up to 0.11% in 2019.
During the Great Recession, the one-year Baa default rate equaled 1.03% in 2008 and 0.94% in 2009.
Prior to the Great Recession, the Baa default rate averaged 0.03% during 2003 through 2007. Earlier, the one-year Baa default rate rose from the 0.18% of 2001’s recession year to 1.01% in 2002.
Before 2002, one needs to go back to 1940’s 1.37% to uncover the last time the Baa one-year default rate was at least 1%. The record high one-year Baa default rate was 1938’s 1.99%.
The moving 10-year average for the one-year Baa default rate peaked at the 1.23% of the span-ended 1940, which overlapped the Great Depression. The two subsequent peaks for the moving 10-year average of the Baa default rate were the 0.29% of 1991 and the 0.37% of 2011. The one-year Baa default rate averaged 0.08% during the 10-years ended 2019.