

By Zain Vawda
Bitcoin continues to toil in a landscape of intensifying geopolitical conflict and regulatory hurdles. The world’s leading cryptocurrency is struggling to maintain its footing, currently hovering around the $67,000 to $68,000 mark.
Bitcoin has made three attempts to gain acceptance above the $70,000 handle since February 5, with each attempt being met by selling pressure.
For the month of February, Bitcoin is currently down around 28%.
Given the rejections above the $70,000 level and the factors below, is Bitcoin ready for another leg lower toward the $50,000 mark?
Geopolitical Tension and Risk-Off Sentiment
The primary catalyst for the recent decline is a surge in global geopolitical tension. Traditionally viewed by some as “digital gold,” Bitcoin has recently behaved more like a high-risk asset. As tensions escalate, investors are retreating from volatile markets in favour of traditional safe havens like the US dollar and physical gold.
This “risk-off” sentiment has triggered liquidations across the board, affecting not just Bitcoin, but Ethereum and major altcoins, like XRP.
Regulatory Stalls: The “Clarity Act”
Adding to the bearish momentum is the renewed stalling of the Clarity Act in Washington.
For months, the crypto industry has been banking on this legislative framework to provide the legal certainty needed for broader institutional adoption.
The latest delays have deflated hopes for a near-term regulatory breakthrough, leading to a sense of exhaustion among traders who were expecting a “regulatory tailwind” to push prices toward new highs.
Corporate Treasuries Under Fire
The downturn is putting immense pressure on corporate “Bitcoin Treasuries.”
In a bold show of conviction, Strategy (MicroStrategy) recently “scooped up” another 2,486 BTC at an average price of $67,710. This brings their total holdings to over 717,131 BTC. However, with the current market price dipping below their recent purchase levels, the firm reported substantial operating losses, reflecting the risks of the treasury model.
Japan-based Metaplanet reported a staggering valuation decline of approximately $665 mln (JPY 102.2 bln) on its holdings, highlighting the volatility that public companies face when anchoring their balance sheets to digital assets.
Add to this the growing calls from analysts from major banks which have cautioned that we are likely to “see more pain” before a sustainable recovery begins and the apprehension by market participants becomes partially explained.
There is also a rise in Bitcoin ETF redemptions and the recent rotation of capital into artificial intelligence (AI) sectors which are contributing to the current liquidity drain.
What does the technical picture say about Bitcoin’s next potential move?
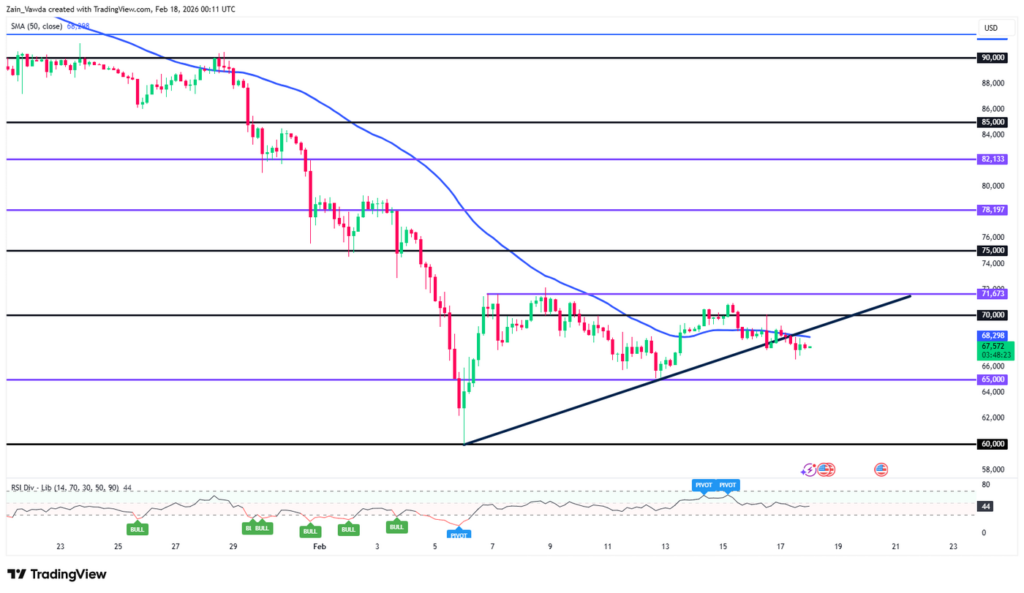
Looking at the chart below, price action toward the end of the trend illustrates a Symmetrical Triangle pattern being in play. In this specific Bitcoin (BTC/USD) chart, the pattern is formed by two converging trendlines:
Lower Trendline: A rising support line (black) connecting the higher lows since the major bounce near $60,000.
Upper Trendline: A descending resistance line (implied by the recent lower highs) that is squeezing the price into a narrow range.
Key characteristics:
Consolidation: After the sharp drop from $90,000, the market is “coiling,” meaning volatility is decreasing as buyers and sellers reach a temporary equilibrium.
The Pivot Point: The price has broken below the apex of the triangle and the 50-period SMA (blue line), which is acting as a dynamic pivot or support/resistance zone.
The Breakout: In technical analysis, a decisive close below this lower support line would confirm a bearish breakout, suggesting a move toward the next major support level at $65,000 or even $60,000.
If the bearish momentum continues and the price stays below the $68,288 level, a move lower toward $60,000 and potentially $56,625 may be on the cards.
Should this prove to be a “fakeout” and the price climbs back inside and breaks the upper resistance, the upside targets could be approximately $79,971 (near the $80k mark). This would require a break of immediate resistance areas at $68,288 and $70,000 first.
Zain Vawda is market analyst at OANDA
Visit https://www.marketpulse.com/ to find out more about the beat of the global markets.