By Naeem Aslam
Gold prices flirted with important price points this week as traders increased their bets that the Federal Reserve has less exercise to keep interest rates at ultra-high levels.
The general stance among traders is that perhaps the Fed will cut rates as early as September. Despite the disappointment of not being the first major central bank among the Bank of England and the European Central Bank to lower their rates by next month, a rate cut is still imminent.
While most traders are focused on the Fed’s monetary policy, the dollar’s weakness, and the correlation of all of this with the gold price, traders may also need to pay attention to another important factor, which smart money is paying very close attention to.
Inflation Data and the Price of Gold
On Wednesday, the US inflation data brought much-needed good news for US consumers and for the US economy as it showed that the CPI reading is perhaps once again back on the right track.
For the past few months, we have seen the inflation number moving in the wrong direction, and higher after a strong decline. The move made many traders and investors worried, as did the Fed.
The is: why does inflation begin to move in the wrong direction, and what would that mean for the Fed’s monetary policy, which underpins the price action for the yellow metal because of the movement in the dollar index?
The Fed’s Jerome Powel, in his latest statements, gave mixed signals.
First, he said that the next move is unlikely for the Fed to increase interest rates. Second, he also said that the Fed is not satisfied with the inflation performance.
However, this information was based on pre-US CPI data, and once again, a single reading does not establish a trend or confirm a direction. Therefore, the Fed could potentially dampen market expectations of interest rate cuts, which many now anticipate in September.
However, we do think that the Fed will cut rates by September, as by that time, we will have enough information and data on US inflation, and if we see another reading like this week, the interest rate expectations for the September rate cut could come backward, and that may be in July—only if there is improvement in the inflation data.
A Hidden Factor Impacting the Gold Price
Smart money is actually paying attention to something that is more important than the Fed’s monetary policy, but this particular factor makes the Fed’s monetary policy totally irrelevant.
The shift from a dollar-denominated trade system is the factor.
Vladimir Putin’s visit to China on Thursday has marked another important event, as the two countries are looking to trade in their own currencies, and this makes gold even more important.
When a country seeks to transition from the dollar-denominated system, it is crucial to have gold reserves to support its currency, with China and Russia playing a significant role in gold demand.
They must increase their gold reserves to maintain the value of their currency, even as they include other soft commodities in their mixed basket to demonstrate their ability to trade and trust each other’s currencies.
In the event of a currency crisis, the inclusion of gold in the basket will provide stability and value to the currency.
India has already begun trading in its own currency with Russia for oil, and discussions are well underway for the UAE to engage in currency exchanges with China, India and Russia. All of this puts the dollar-denominated exchange system at much greater risk.
If we take a closer look, assuming Donald Trump is the next President and adhering to the same trade tariff rules as before, it’s not difficult to imagine how the Eurozone would initiate discussions about trading with countries using its currency against theirs.
The Price Action
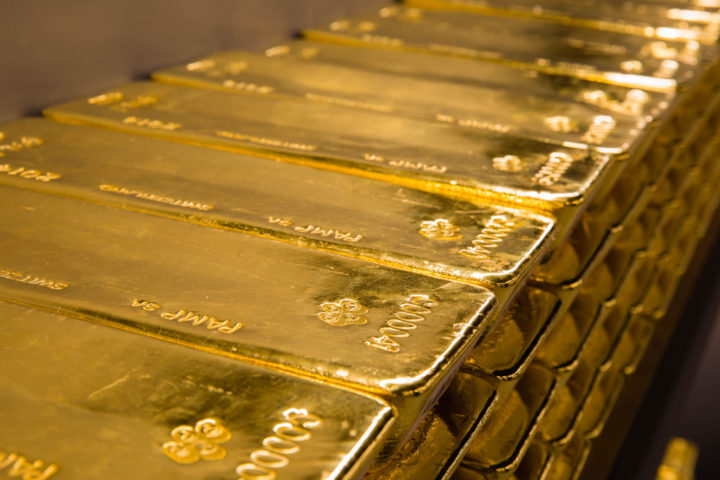
Once again, the price of gold is at an important level, and it has started to flirt with all-time highs.
This week’s upward move has pushed the price against the resistance level, as shown in the chart below. Given the explosive move to the upside and nothing important in terms of economic data, we could see a gradual move towards the upward trend line, shown in pink.
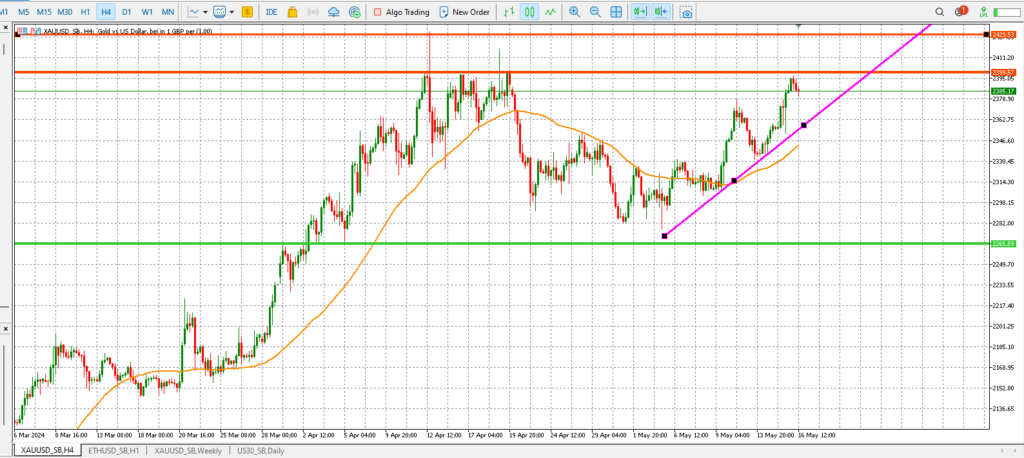 As long as the price continues to trade above the 50-day simple moving average (orange line), it is likely to continue its upward trend. The green horizontal line indicates the immediate support zone, and the price’s current main resistance is its all-time high, which it can reach if it surpasses the current resistance level of $2,399
Naeem Aslam is Chief Investment Officer at Zaye Capital Markets.
The views and opinions expressed herein are the views and opinions of the author and do not necessarily reflect those of Zaye Capital Markets.