By Moody’s Analytics
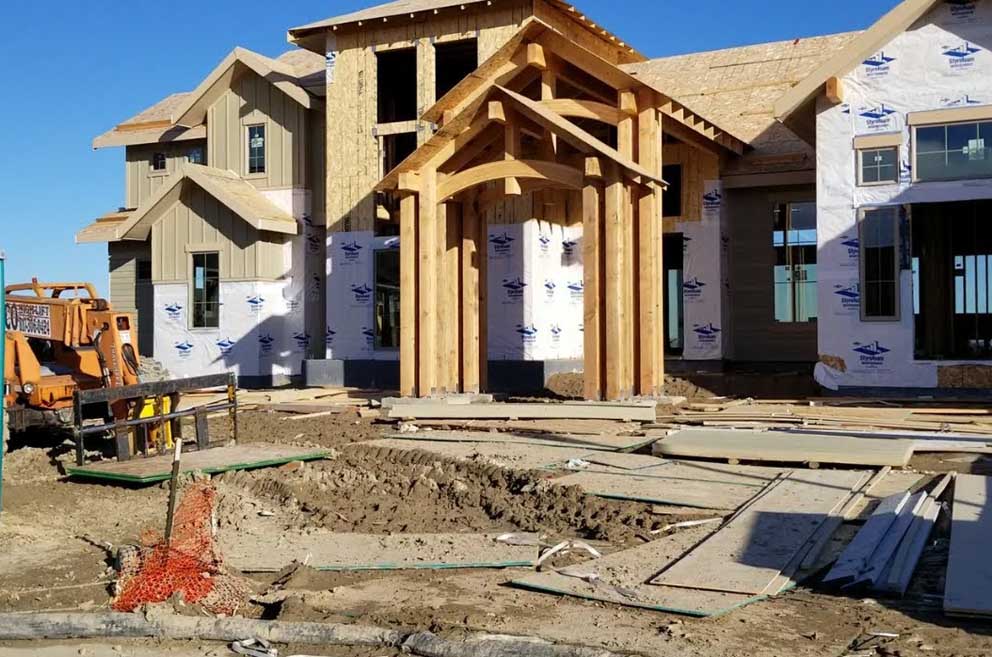
U.S. homebuilding has found a floor following an almost year-long slide in building activity. Total housing starts ticked higher in April, climbing 2.2% to 1.4 million annualized units. Multifamily starts increased by 3.2%, and single family starts increased by 1.6%.
As expected, the March construction data were revised lower. An unseasonably warm winter complicated the seasonal adjustment process and can overstate the number of new housing units started. Permits ticked lower, falling 1.5% below last month’s reading.
U.S. homebuilders are feeling optimistic for the first time in 10 months. May brought the fifth consecutive month of improvement in the NAHB Housing Market Index and was the first reading above the 50-point threshold marking good building conditions since July.
High mortgage rates and poor affordability continue to keep potential buyer traffic suppressed, but current and expected home sales are rising. Improvement is widespread, with all four regional scores increasing on a three-month moving average.
Weak housing demand remains the biggest hurdle for the new-home market. Buyer traffic is the only subcomponent below the 50-point threshold. Constrictive monetary policy is keeping costs associated with buying a home high. The 30-year fixed mortgage rate continues to hover in the mid-6% range. But our forecast expects mortgage rates to slowly decline in the second half of 2023 and throughout 2024.
Mortgage applications seem to have bottomed and are headed in the right direction. Also, house prices are in the midst of a modest correction. House prices are forecast to fall 10% from peak to trough, which is a much smaller correction than in the previous housing bubble collapse in the 2000s. Lower house prices will be a plus for housing demand
Little hope on the U.S. factory front
U.S. manufacturing activity has been on a downward trajectory for more than a year now. While manufacturing payrolls had managed to continue growing in the face of obvious signs of weakness, the March employment report showed the first contraction of factory employment since April 2021. Over the last three months, job gains have averaged just 2,000, compared with a 19,000 average at the end of 2022 and a 49,000 average at the end of 2021.
The ISM manufacturing index has signalled an ongoing contraction in manufacturing activity—moving below the neutral threshold of 50 back in November—and the early data for May from regional Fed manufacturing surveys paints a bleak picture.
Data from the Empire State Manufacturing Survey and the Philly Fed’s Manufacturing Business Outlook Survey released this week point to manufacturing activity remaining in recessionary territory.
Any good feelings associated with April’s better-than-expected Empire State survey results have given way to renewed concern. Not only did the topline general business conditions index revert to contractionary territory for the fifth time in six months, but it fell spectacularly. The decline from 10.8 to -31.8 marks the second-largest monthly drop in the survey’s approximately 22-year history. Demand indicators drove the weakness, experiencing precipitous falls of their own.
The six-months-ahead general business conditions index, which climbed slightly to a three-month high of 9.8, suggests there remains some optimism about the second half of this year.
The Philly Fed survey surprised to the upside in May but remains firmly negative. The headline diffusion index rose from April’s reading of -31.3, its lowest in three years, to -10.4 in May. Current business conditions improved. The new orders diffusion index rose from -22.7 to -8.9, on net. The shipments index ticked up from -7.3 in April to -4.7 in May.
Price pressures continue to moderate. Employment indexes were downbeat. Around 7% of respondents reported adding staff in May, down from 16% the month before.
Given this, early signs point to the ISM manufacturing index falling further into contractionary territory in May after a slightly improvement in April. The national index of manufacturing activity has closely tracked the trend of a composite index of the New York and Philly Fed surveys over the last year, which is signalling that manufacturing activity is near its weakest level since April 2020.
We do not assume a sharp contraction in manufacturing activity is looming, as our baseline forecast has the U.S. economy skirting a recession this year. However, after adding nearly 400,000 manufacturing jobs in 2022, factory payrolls will backtrack slightly this year as the weakness in goods spending persists.
Outlook for growth improves, modestly
Second-quarter output growth, according to the Moody’s Analytics high-frequency GDP model, rose from an annualized 0.5% to 0.8%. A swath of April data released this week is behind the brightened outlook, though a further deceleration from the first quarter’s 1.1% annualized gain to 0.8% should hardly inspire optimism.
Retail sales rose in April for only the second time in the last six months. January was the other gain. Increases in core goods prices likely contributed to the gain, so it does not suggest much of a pickup in the amount of merchandise retailers are selling. There were several factors weighing on sales. Spending is continuing to shift back from goods to services. We expect services consumption contributed 1.4 percentage points to growth in the second quarter while goods consumption delivers a modest drag.
As 2023 continues, the trend is likely to be one of modest growth in retail sales. Most of the gain will come from prices as there will be little, if any, real growth in spending at retail.
The contribution from rising prices will be modest compared with the last two years, but sizable compared with pre-pandemic norms. Consumers continue to draw down the excess saving done during the pandemic, although support from this source is fading, as evidenced by the rising saving rate. High interest rates are making payments on purchases financed with credit more expensive than consumers are accustomed to. House prices are falling, undermining household wealth. Job growth is slowing.
U.S. industrial production surprised to the upside in April, though downward revisions to previous months rained on the parade. April’s 0.5% gain surpassed expectations.
However, March’s growth was revised down from 0.4% to 0%. February’s figure was adjusted negatively as well from a 0.2% expansion to 0%. Rising borrowing costs and a pervasive uncertainty about the U.S. economy’s near-term trajectory will weigh on business investment. We expect non-residential investment is a 0.3-percentage point drag on second-quarter GDP growth.
Similar dynamics are weighing on inventories, which will lead to a negative contribution to output growth.
Growth is turning to depletion after two years of firms playing catchup with supply-chain issues. Wholesalers will likely see the biggest inventory losses as they are holding on to the largest number of excess inventories out of any segment.
With heightened macroeconomic risks, wholesalers are fearful of being caught with overstocked warehouses if a recession does materialize. Business inventories fell 0.1% from February to March. This month’s pickup in sales for wholesalers will help further deplete inventories next month and better position businesses in case of a downturn.